Reports and Spreadsheet Sync
- T3 API Reports
- How to get started with T3 API Reports?
- Advanced Usage
- Spreadsheet Sync
- How does it work?
- How to get started with Spreadsheet Sync?
- Demo of Advanced Spreadsheet Sync Usage
- Next Steps
T3 API Reports
T3 API Reports allow you to export entire Metrc datasets in a single request. Report endpoints can be filtered and sorted just like collection endpoints.
An example: - The /v2/packages/active collection endpoint returns one page of active packages. To export all your active packages, you would need to request multiple pages to load all your active packages. - The /v2/packages/active/report report endpoint returns all your active packages. This returns the entire dataset in one request, so the response can be very large.
How to get started with T3 API Reports?
Become a T3+ subscriber.
T3 API Reports are only available to T3+ subscribers. You can start your 30 day free trial here.
Advanced Usage
Filtering and Sorting
T3 API Reports can be configured to include filters, sorting, and can return either JSON or CSV data.
- If you wanted to only return packages in the Bulk Storage room, you would add
&filter=locationName__eq:Bulk Storageto your Sync Link - If you wanted to control which columns you want in the report, you would add
&fieldnames=label,productionBatchNumber,labTestingStateNameto your Sync Link
Details here: https://api.trackandtrace.tools/v2/docs/#/Reports/get_v2_packages_active_report
Specifying Field Names
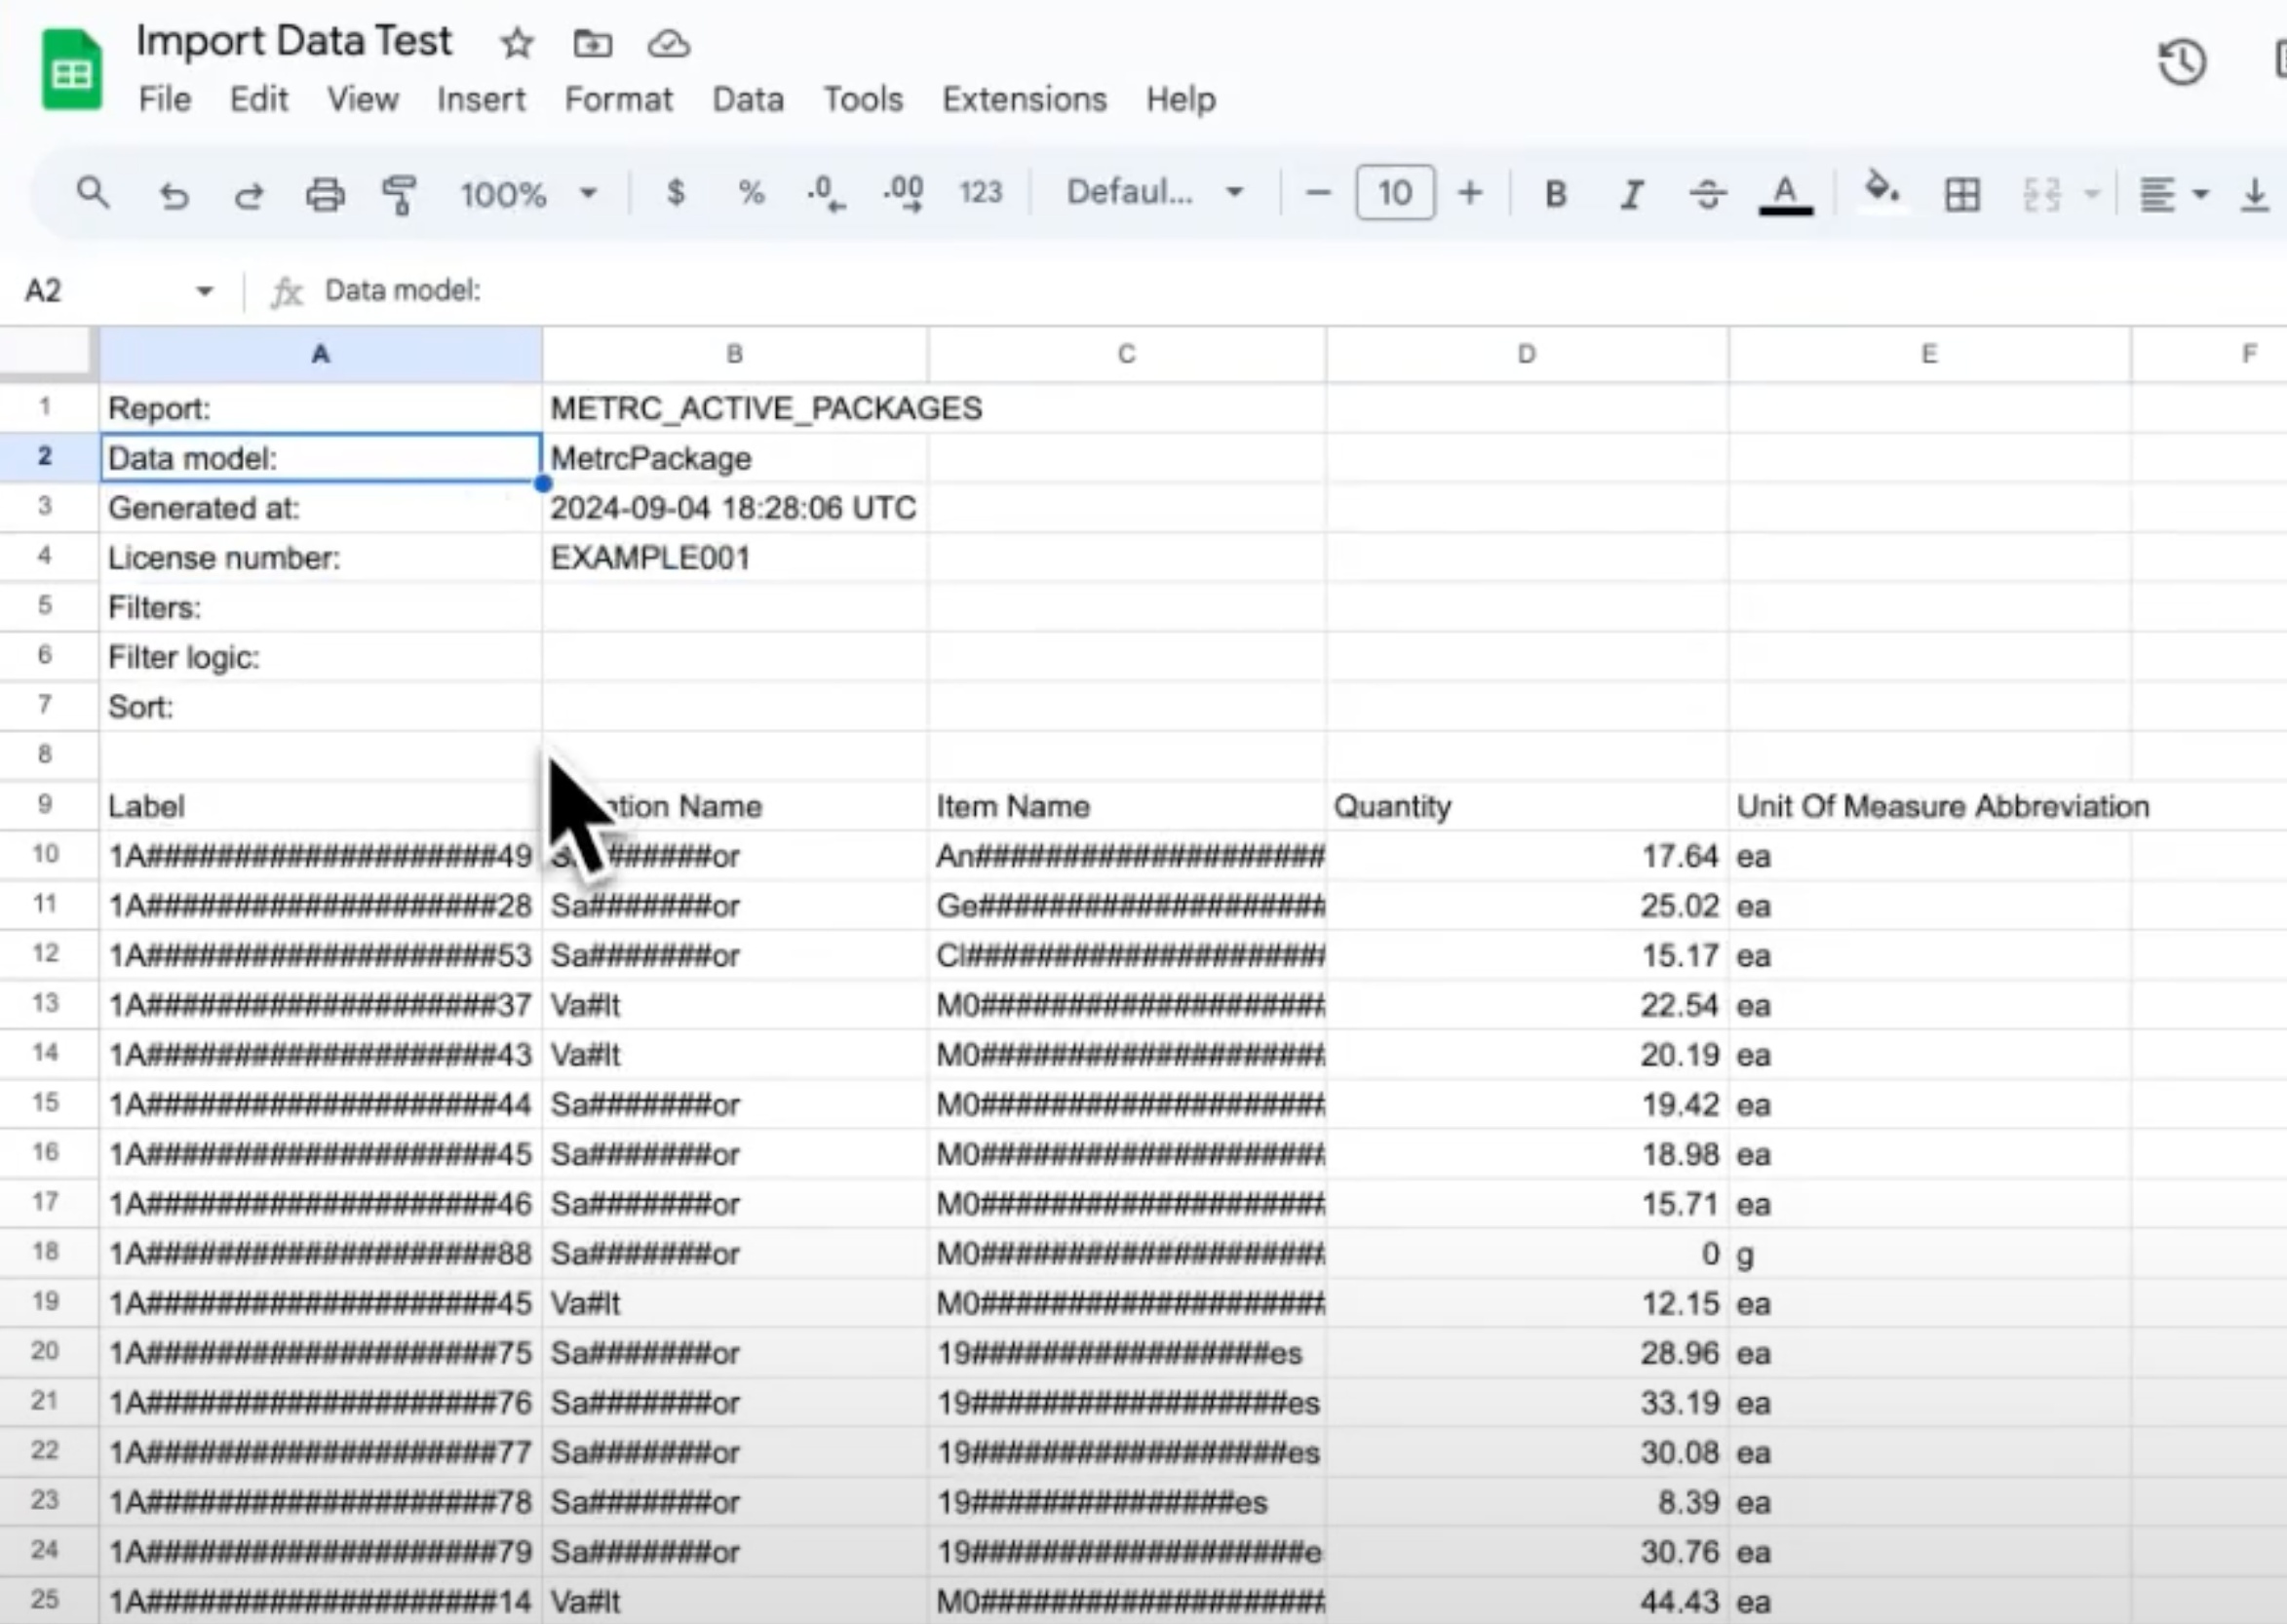
Example T3 API output in CSV format
Each report header shows dataModel. The dataModel describes what objects are being returned for the current report, and what columns are available.
In the API response, the data model is listed as MetrcPackage. To see a list of columns for MetrcPackage, refer to the API docs: at the bottom of the page, there is a Schemas section:
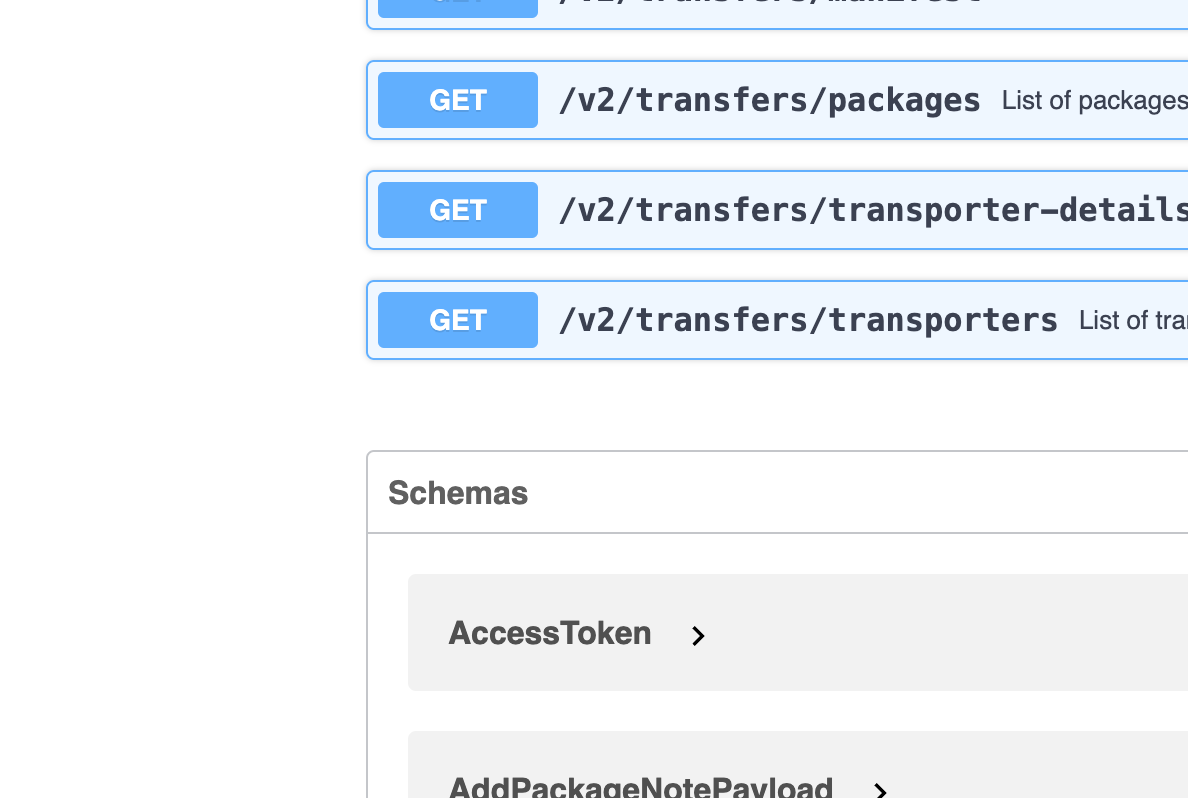
T3 API schemas
In Schemas, find MetrcPackage and expand it to see all the possible columns:
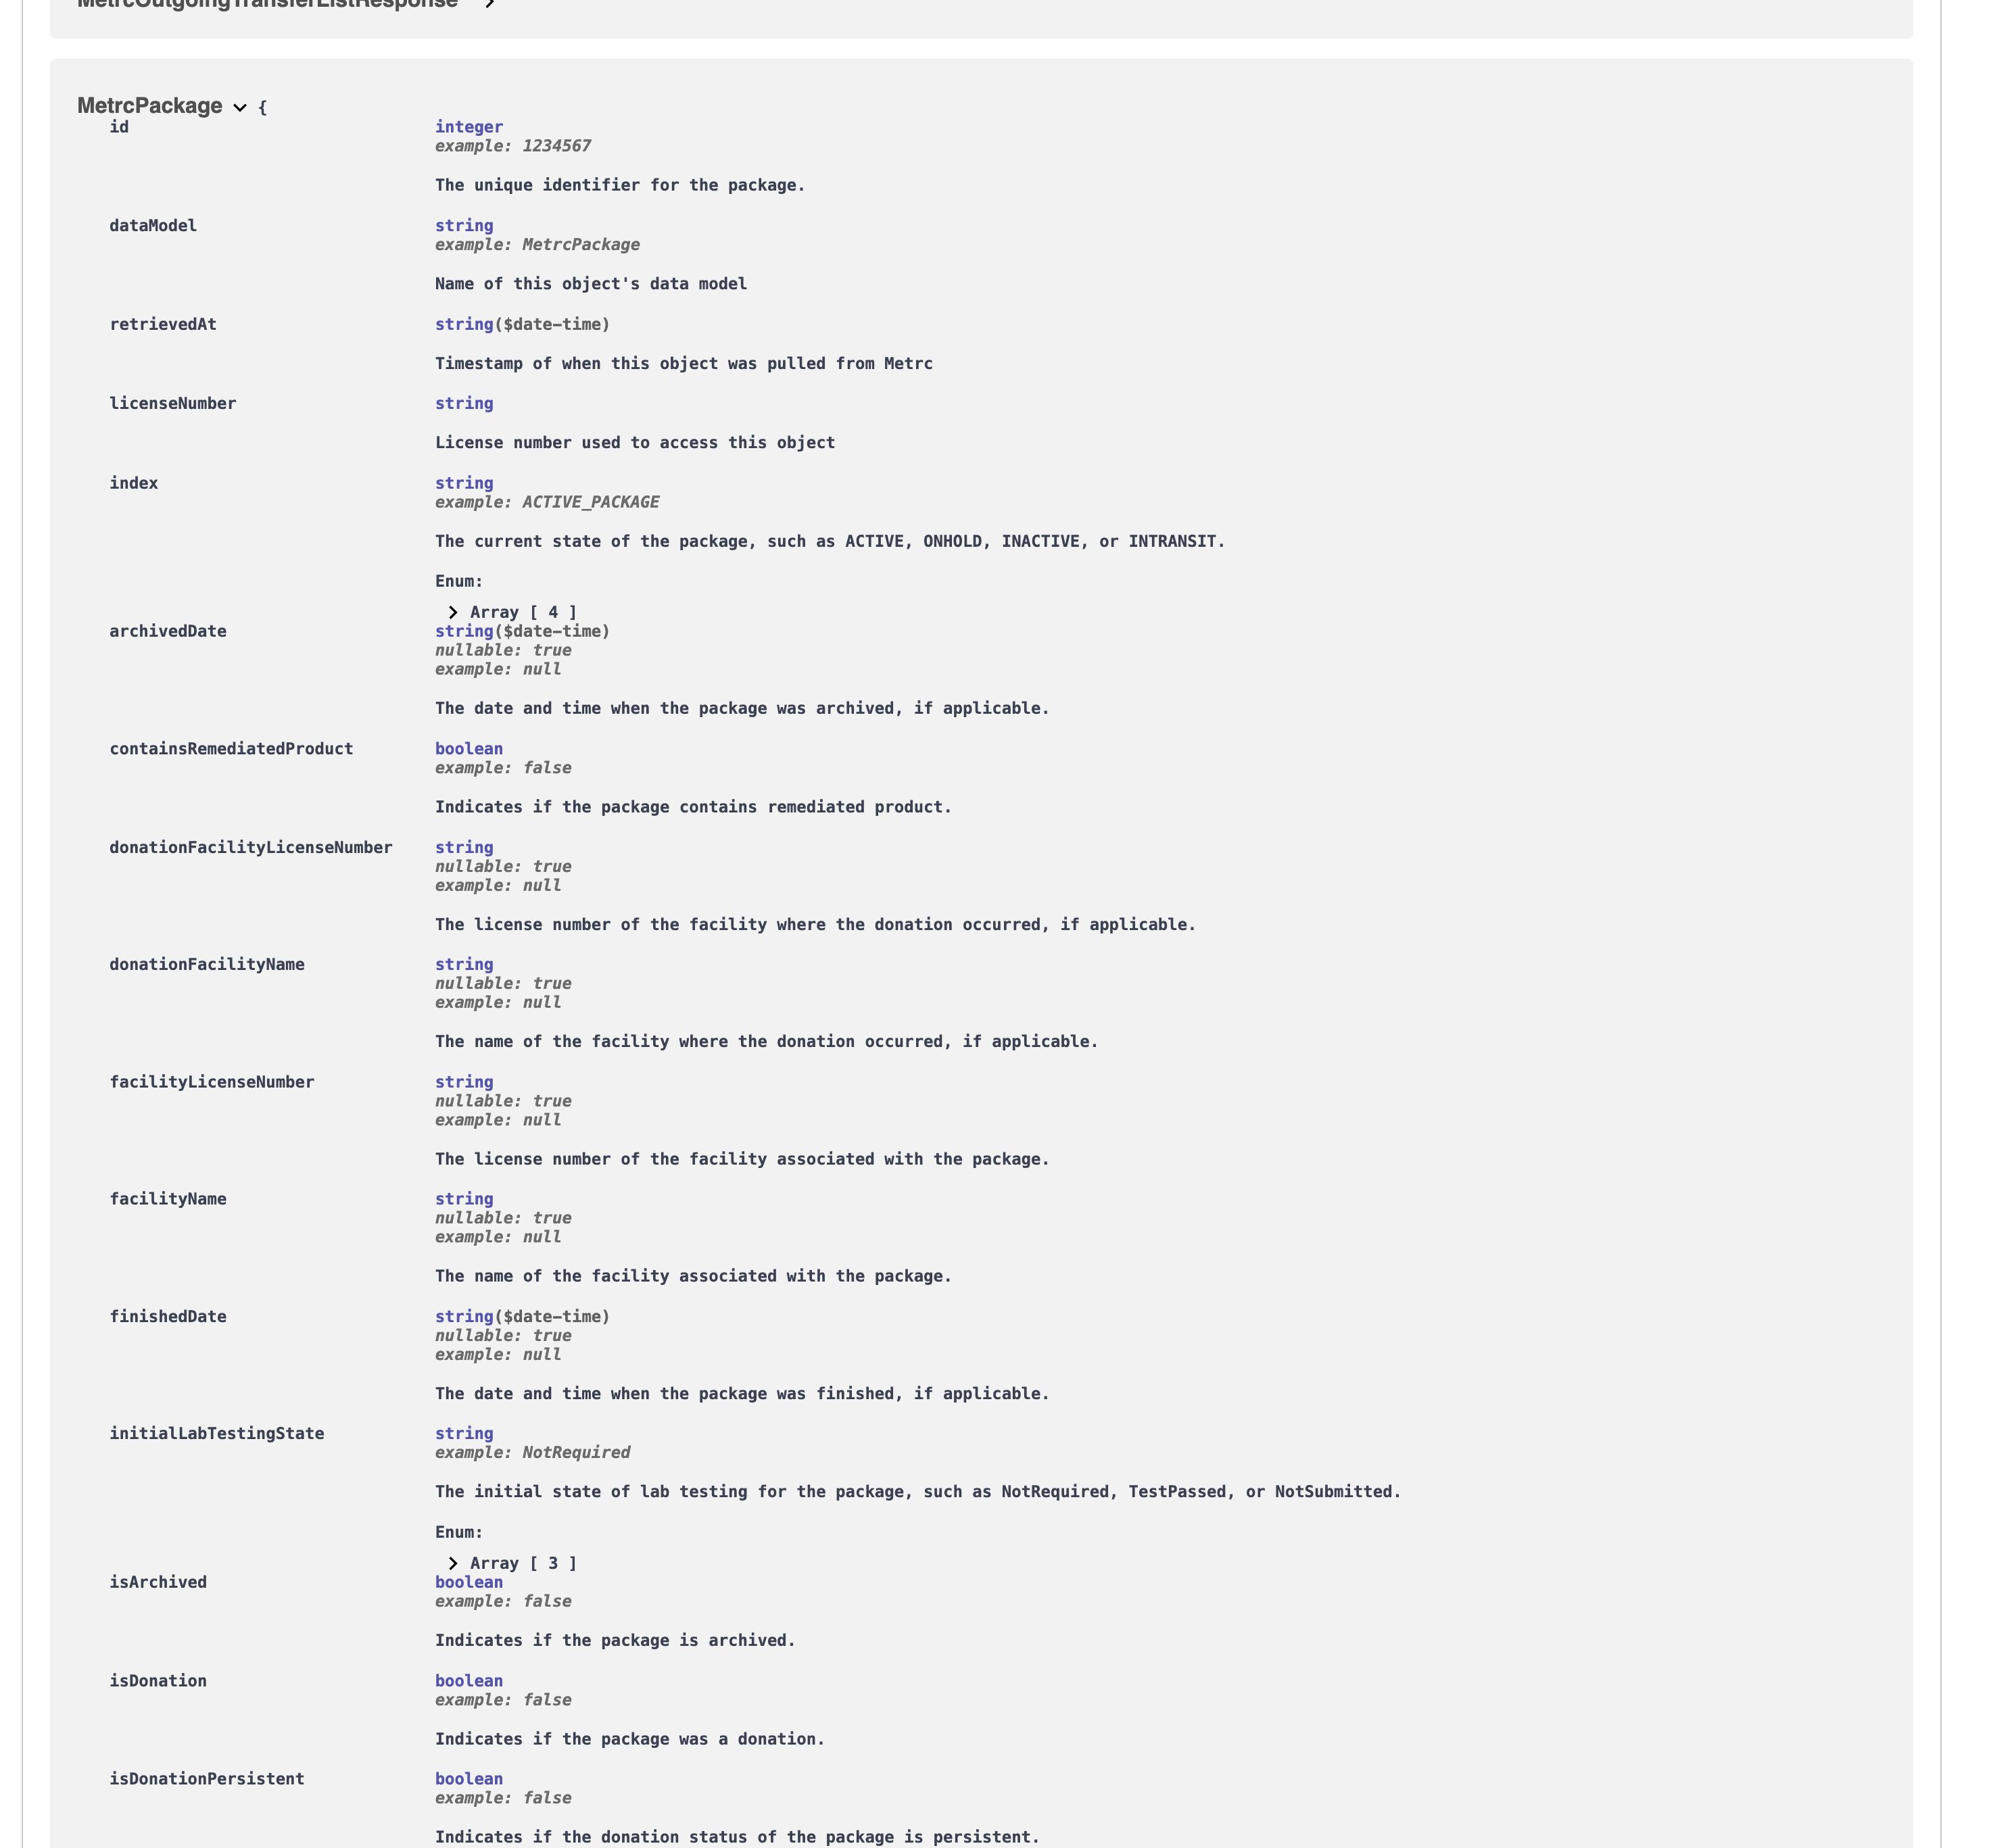
T3 API MetrcPackage schema
So if you wanted to specify the columns to show License Number, Facility Name, Label, and Production Batch Number, you would add the following to your Sync Link:
https://api.trackandtrace.tools/v2/packages/active/report?licenseNumber=...&fieldnames=licenseNumber,facilityName,label,productionBatchNumber
These will be returned as the column headers.
MetrcPackage has a special scenario, where item is nested inside it.
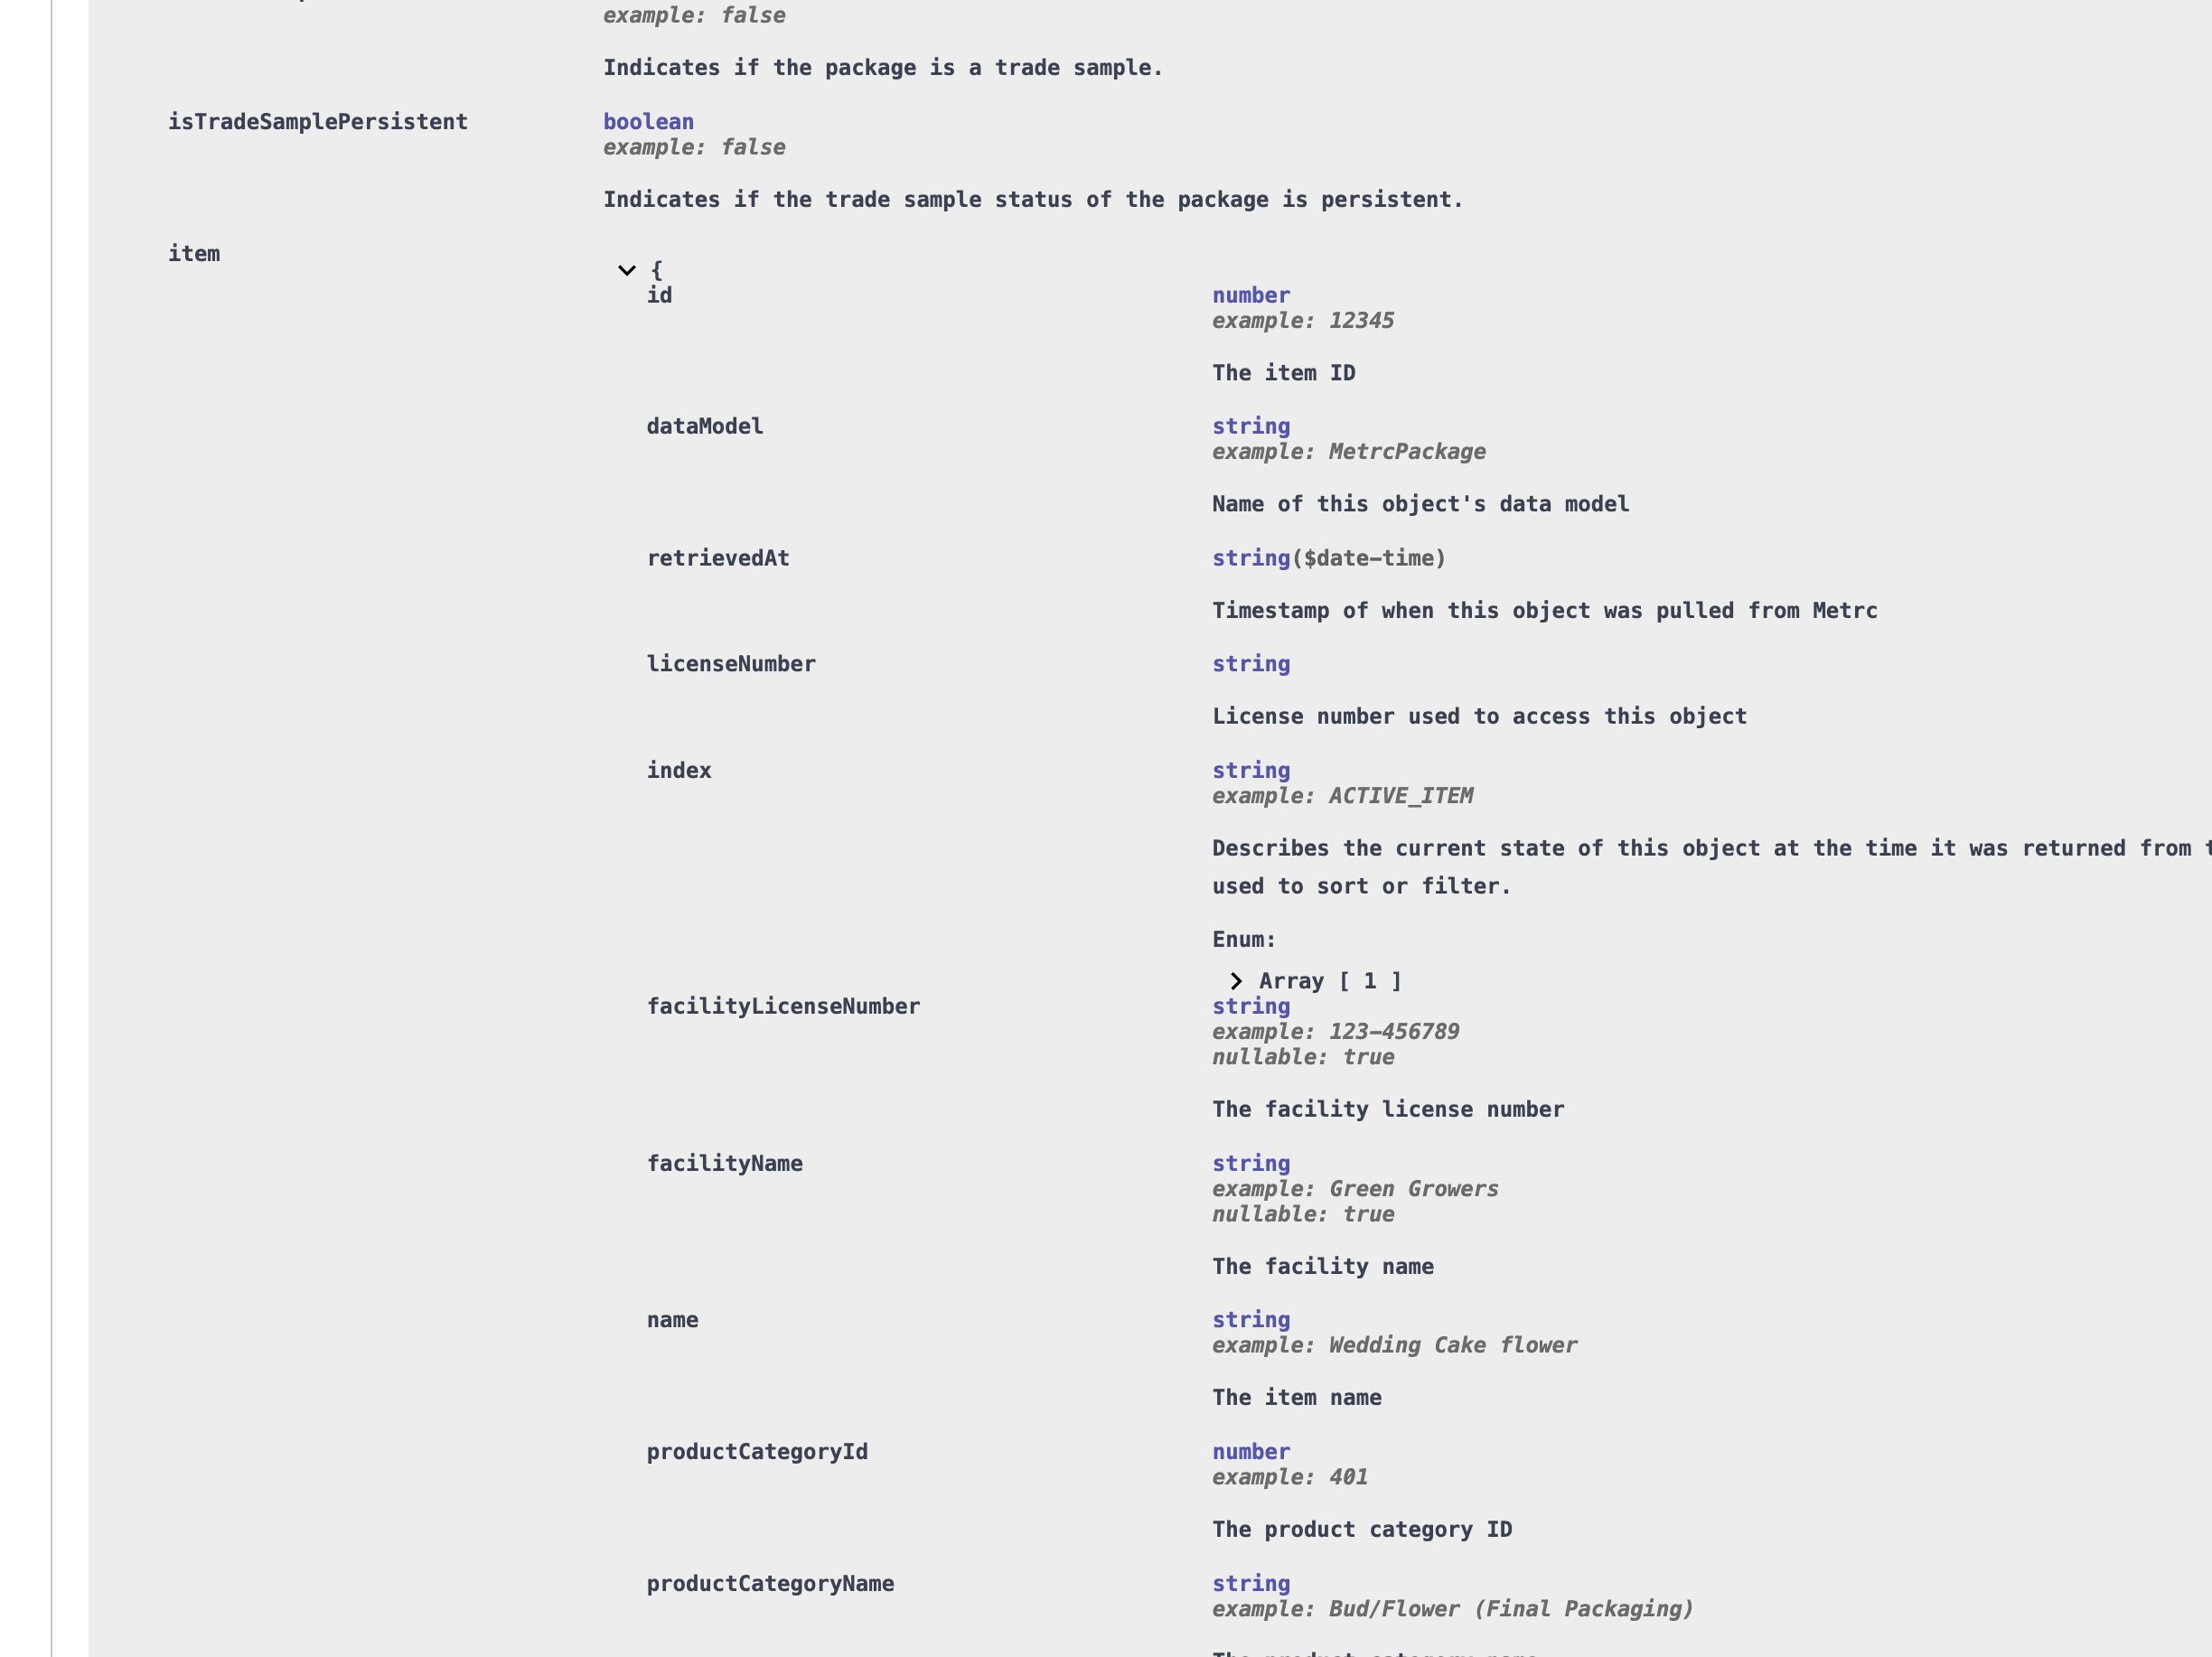
T3 API nested item schema
If you want to show an item column, you add item.* in front of it. For example, the Item Category, you would use item.productCategoryName.
Example URL:
https://api.trackandtrace.tools/v2/packages/active/report?licenseNumber=...&fieldnames=licenseNumber,facilityName,label,productionBatchNumber,item.productCategoryName
Spreadsheet Sync
Spreadsheet Sync uses T3 API Reports to import entire Metrc datasets into a spreadsheet with a single cell formula. The spreadsheet will stay up-to-date with Metrc (updating at least once per hour).
Demo of Spreadsheet Sync
How does it work?
T3 API Reports capture snapshots of your Metrc data all in a single request. Spreadsheet Sync allows you to form a single Sync Link that loads your report data. This Sync Link can then be passed to either Power Query in Microsoft Excel or the IMPORTDATA() formula in Google Sheets.
How to get started with Spreadsheet Sync?
1. Generate your secret key
- Generate your secret key here.
- Store this secret key in a secure place, there is no way to access it again.
- Do not share this secret key! It allows access to your Metrc data
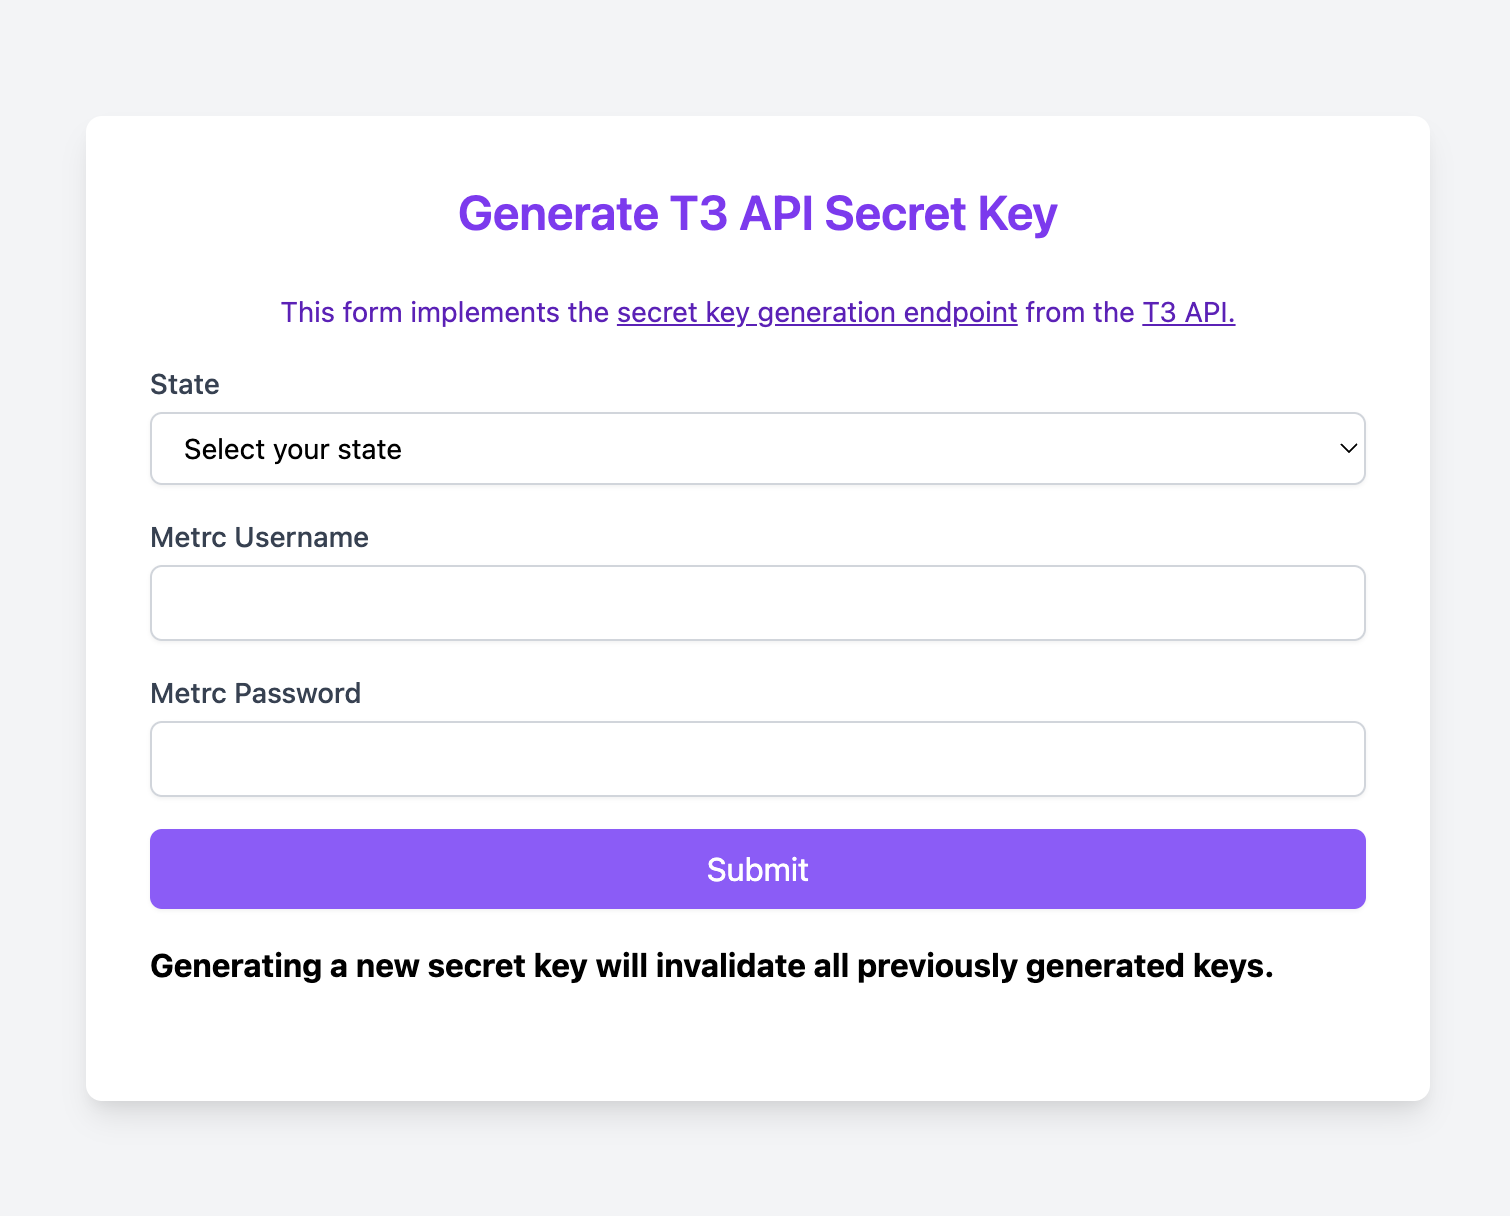
Secret key generation interface
2. Create your Spreadsheet Sync Link
Use this tool to help you build your sync link
All the information needed to generate the report is included in the Sync Link. At minimum, you will need:
- The path of the report you wish to generate (available in the API docs)
- The license number for the data that should appear in the report
- Your secret key
For example, let's say you want to create an Active Packages report for the EX-00001 license.
- Report path (taken from the API docs):
/v2/packages/active/report - License number:
EX-00001 - Secret key:
1234-1234-1234-1234-1234-1234
Your Sync Link would be: https://api.trackandtrace.tools/v2/packages/active/report?secretKey=1234-1234-1234-1234-1234-1234&licenseNumber=EX-00001&contentType=csv
Note: contentType=csv is required
Note: Do not share this Sync Link! Anyone who has it can load all your Metrc Data
3. Import Data into your Spreadsheet
For Google Sheets:
Pass your Sync Link to the IMPORTDATA() function. Every hour, this function will load the report data using your Sync Link and insert it into the sheet.
In your spreadsheet, in Cell A1, you would paste =IMPORTDATA("https://api.trackandtrace.tools/v2/packages/active/report?secretKey=1234-1234-1234-1234-1234-1234&licenseNumber=EX-00001&contentType=csv")
Note: IMPORTDATA is a Google Sheets function and is not available in Excel. Excel users should use Power Query (see below).
For Microsoft Excel:
Excel requires the use of Power Query to import data from the web. Follow the instructions here, using your sync link as the data source URL.
4. Allow Spreadsheet to Load Data
Loading your data usually takes 15-20 seconds.
- The
IMPORTDATAfunction automatically refreshes the information about once per hour. - Power Query will refresh the data based on how you configure your data source.
Example output (redacted):
Example output
Demo of Advanced Spreadsheet Sync Usage
Spreadsheet Sync allows for advanced filtering options:
Demo of Advanced Spreadsheet Sync
Next Steps
- Get started with Spreadsheet Sync and generate your secret key here
- Use Supercollections when a report's flat output isn't enough and you also need related metadata (lab results, history, manifest packages).
- Drive report queries from code with API scripts.
- Browse the full set of available report paths in the OpenAPI spec (look for paths ending in
/report). - If you're not subscribed to T3+, start your 30-day free trial here